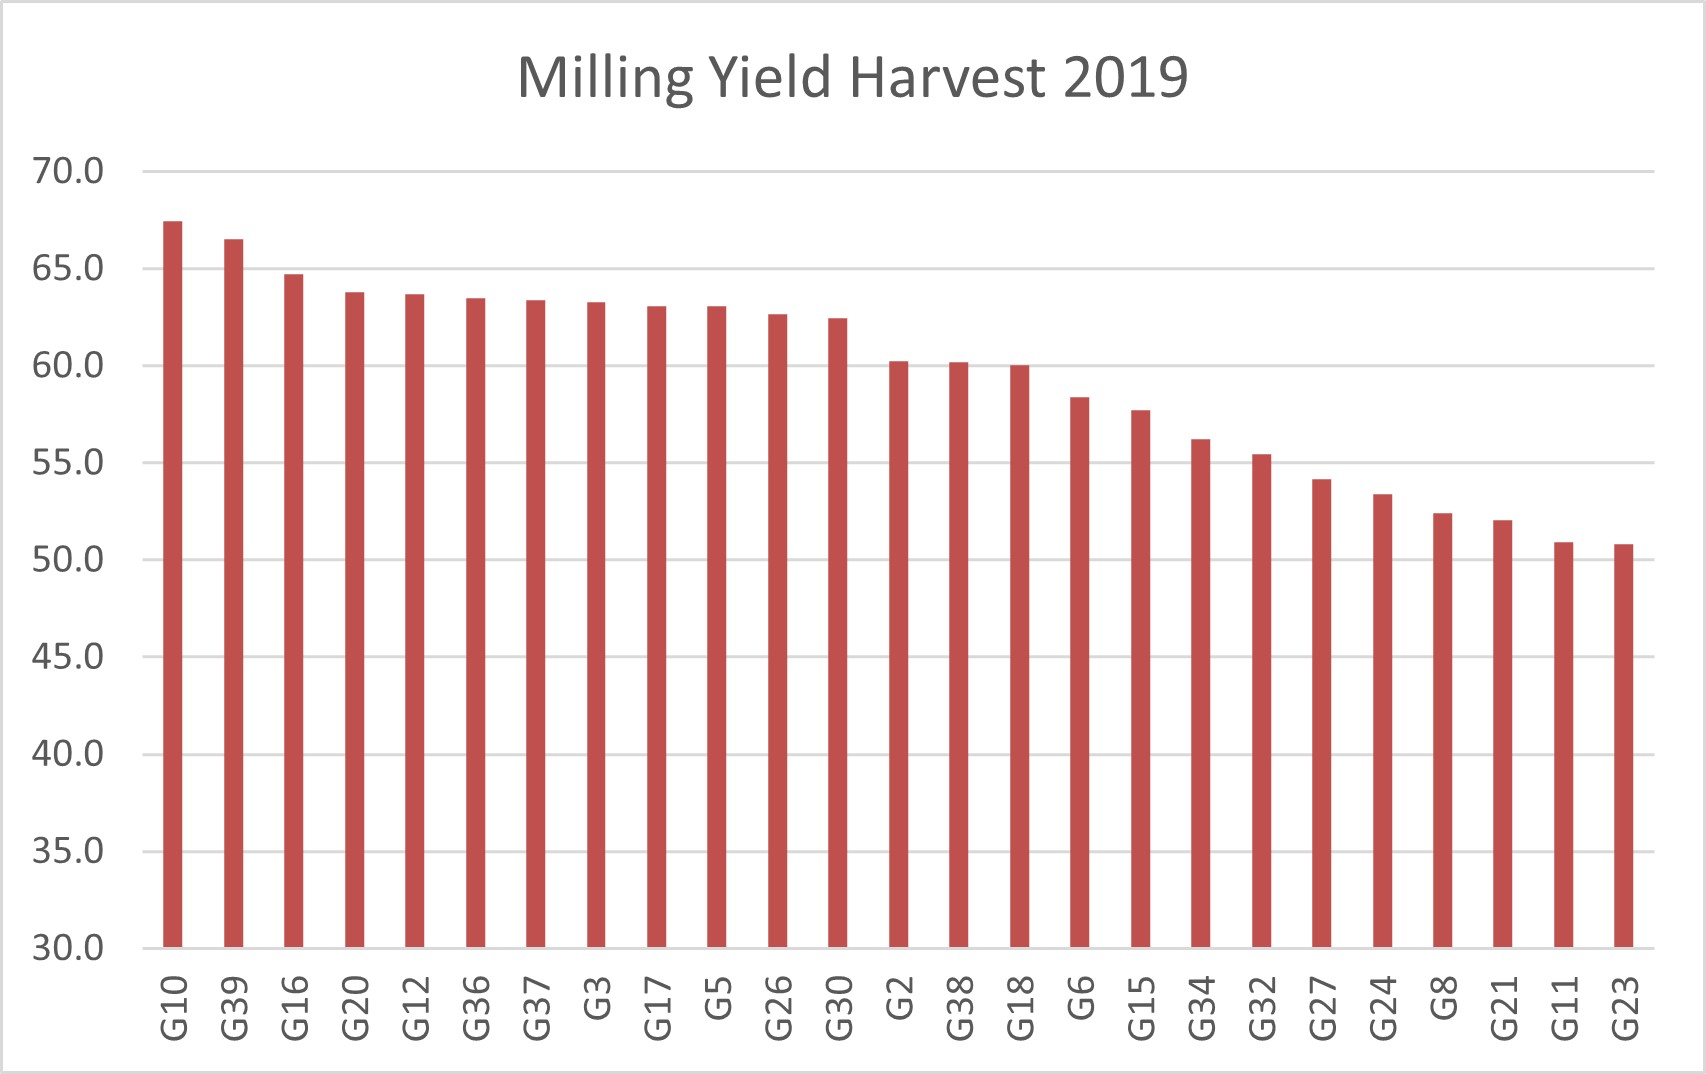
We have some great data from Whites about oat performance through the mill over the last few years. The three graphs below show the performance of each grower, giving the average across all the loads delivered in the year. The figures show the percentage milling efficiency of the grain delivered.
That is the percentage of the grain that is milled from what is tipped. Therefore for every 100 grains tipped there will be 60-odd milled and the poorer samples will have 10 grains fewer milled. This is a spread of about 20% between the best and poorest samples. The cost of the grains with premiums gives a spread of about 6% and so poorer samples are relatively expensive and hence the focus on improving grain quality.
The key criteria is the Kernel Content which is the percentage of grains that have a groat in them and this is largely varietal and fertility driven. From this figure the screenings, foreign grain, admix, groats (grains that have threshed from the husk through the combine) and assumed mill loss of 4% is applied to get a final figure. These figures do not show moisture content and so do not necessarily indicate the premium received for the oats although there will be a strong correlation.
On the graphs below the X axis shows the growers identified by number and you will be receiving your reference number by email shortly (or may have done so) and can see where you sit on the chart. Are you Man City or Southampton to borrow a Premier League analogy?
Some points to note:
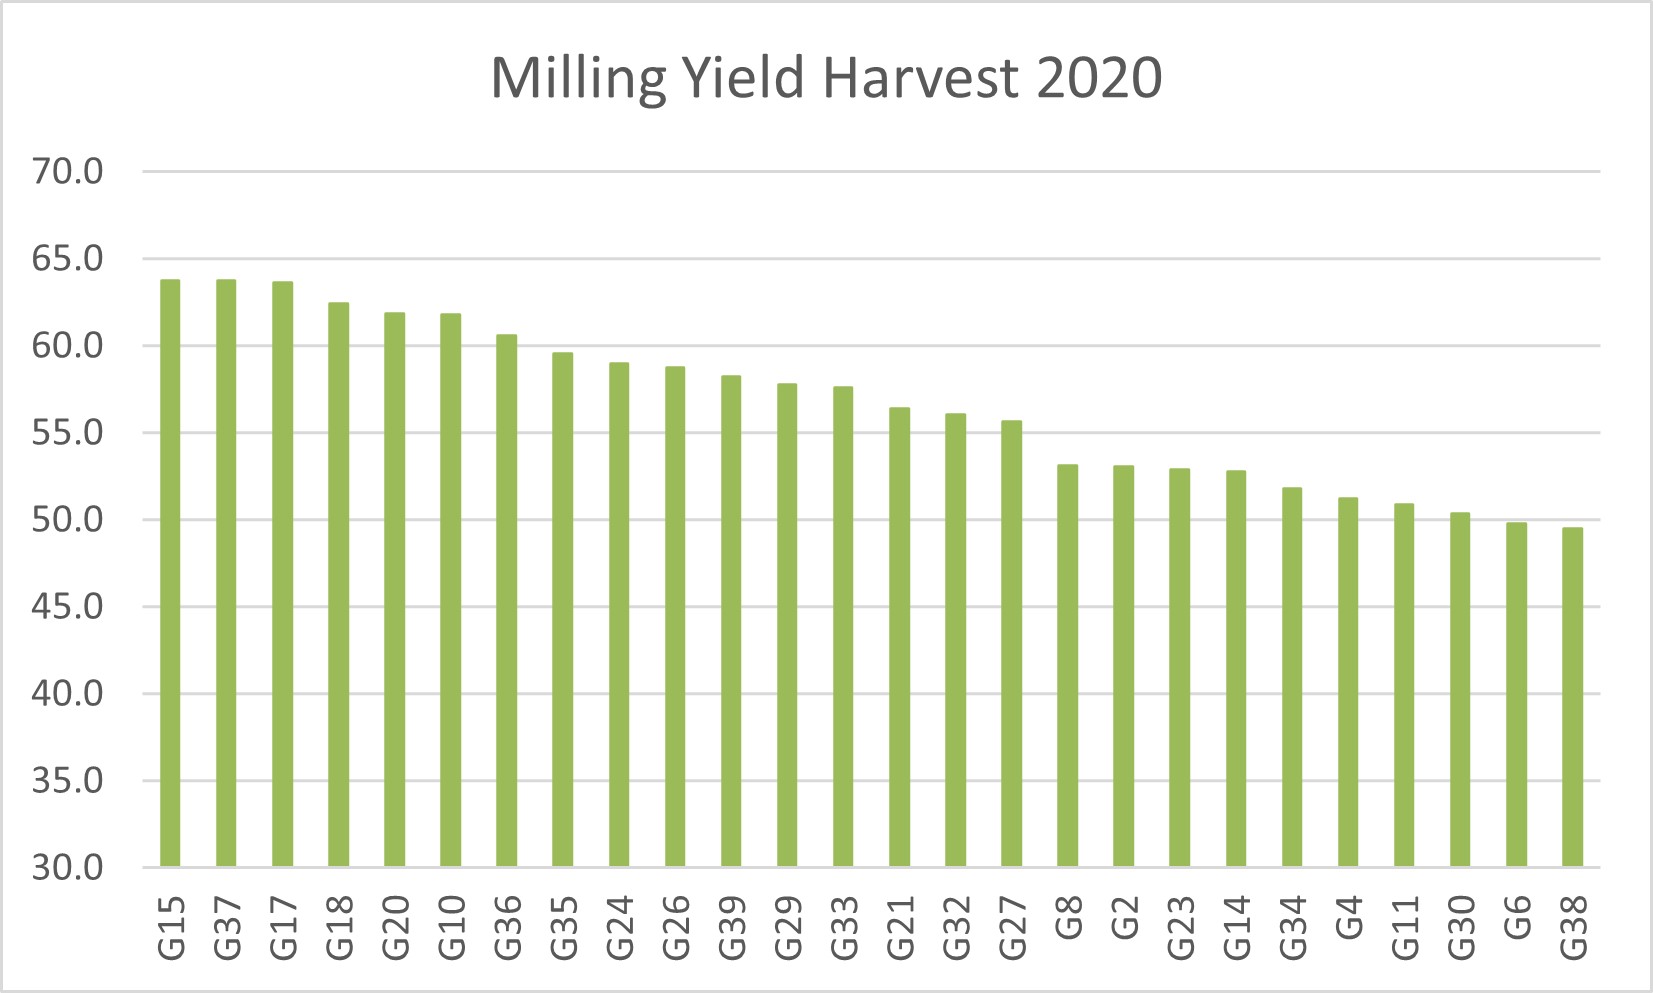
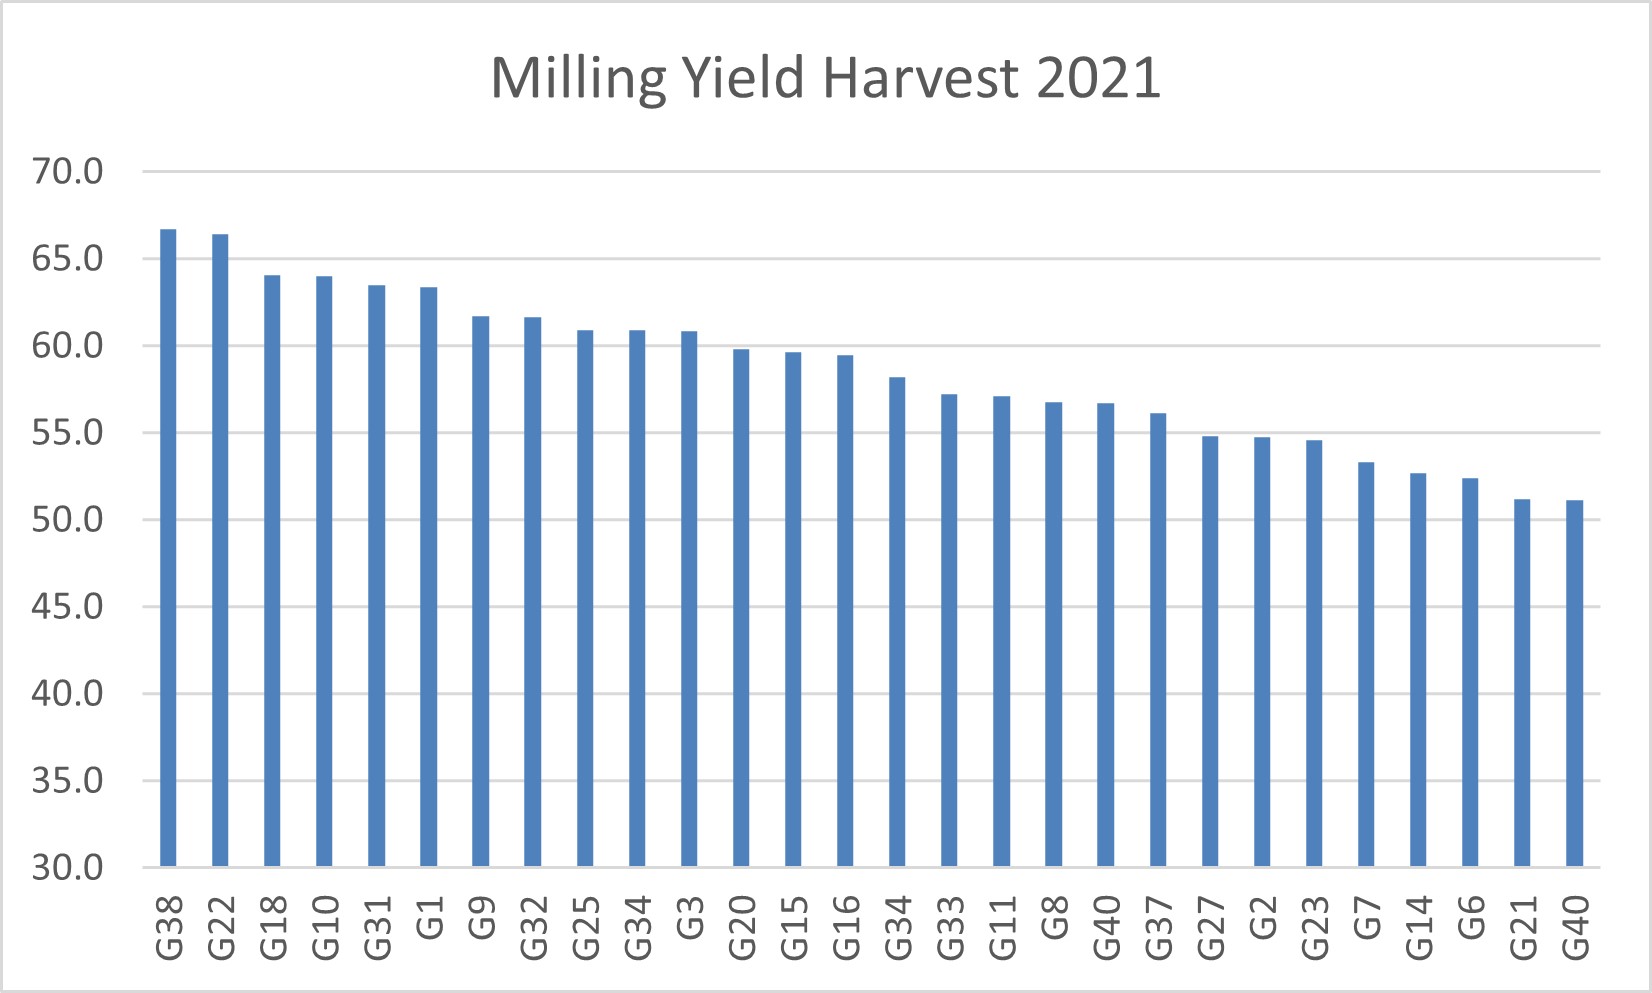
grower 38 moved from bottom of the league in 2020 to top of the league in 2021 by taking more care of their post harvest conditioning
grower 18 moved from mid-table obscurity in 2019 to finish 4th in 2020 and 3rd in 2021 by moving from growing spring oats to growing Mascani
grower 10 has been very consistent being 1st, 6th & 4th over the three years - so what can we learn from them?
Please note that if your oats went to Rushall Store some of the loads delivered from there were not recorded under the original farm name and so are not shown here.
Oat Milling Quality on Intake Sample 2019, 2020 & 2021 shown by grower
Below is a table showing the average data across all three years listed by grower. Take a look at the data and identify yourself. Check your results and consider what you can do to improve the grain quality.
If you have high groats do you need to check the combine settings?
Could you use a different screen in the cleaner to reduce screenings?
Is your variety the best to be using. Review some of the trial data we've published previously or take some advice on which variety to grow
Could you move oats higher up your rotation to take advantage of higher premiums by growing better quality grain?
Average results by Grower for Different Quality Criteria
| GROWER | KERNEL CONTENT | HULLABILITY | SCREENINGS (2.2 MM) | CEREAL ADMIX | FOREIGN SEEDS | GROATS |
| G1 | 73.84 | 98.60 | 4.25 | 0.00 | 0.05 | 0.75 |
| G2 | 72.28 | 95.39 | 3.24 | 0.19 | 0.00 | 4.00 |
| G3 | 75.38 | 98.49 | 3.29 | 0.01 | 0.10 | 4.28 |
| G4 | 65.30 | 94.56 | 2.56 | 0.00 | 0.00 | 2.10 |
| G5 | 74.90 | 98.00 | 3.34 | 0.00 | 0.00 | 2.50 |
| G6 | 72.10 | 96.11 | 7.82 | 0.01 | 0.04 | 2.43 |
| G7 | 71.88 | 97.33 | 9.97 | 0.00 | 0.10 | 1.83 |
| G8 | 73.79 | 94.47 | 5.66 | 0.20 | 0.16 | 2.78 |
| G9 | 72.99 | 97.73 | 3.20 | 1.70 | 0.00 | 0.10 |
| G10 | 75.72 | 98.67 | 2.91 | 0.00 | 0.00 | 3.06 |
| G11 | 71.17 | 97.98 | 7.82 | 0.02 | 0.05 | 4.73 |
| G12 | 74.92 | 98.90 | 4.75 | 0.00 | 0.13 | 1.25 |
| G14 | 67.38 | 99.33 | 8.47 | 0.00 | 0.00 | 1.53 |
| G15 | 70.76 | 99.15 | 4.21 | 0.09 | 0.00 | 0.65 |
| G16 | 73.89 | 98.40 | 3.43 | 0.15 | 0.00 | 2.63 |
| G17 | 74.97 | 97.95 | 1.93 | 0.30 | 0.03 | 3.31 |
| G18 | 74.16 | 96.21 | 3.50 | 0.01 | 0.00 | 0.88 |
| G20 | 73.65 | 97.87 | 3.41 | 0.07 | 0.05 | 2.02 |
| G21 | 69.03 | 94.91 | 5.05 | 0.00 | 0.03 | 0.84 |
| G22 | 75.50 | 99.20 | 2.30 | 0.00 | 0.13 | 1.88 |
| G23 | 70.39 | 98.66 | 8.08 | 0.12 | 0.29 | 3.37 |
| G24 | 72.01 | 97.27 | 6.16 | 0.04 | 0.00 | 2.42 |
| G25 | 71.27 | 97.52 | 2.60 | 0.00 | 0.00 | 1.25 |
| G26 | 72.58 | 98.90 | 4.48 | 0.00 | 0.08 | 2.83 |
| G27 | 72.84 | 95.84 | 6.70 | 0.20 | 0.08 | 2.74 |
| G29 | 69.41 | 98.70 | 3.55 | 0.00 | 0.00 | 2.78 |
| G30 | 74.24 | 97.13 | 4.13 | 0.01 | 0.06 | 3.75 |
| G31 | 74.02 | 97.80 | 1.70 | 0.00 | 0.00 | 2.63 |
| G32 | 70.13 | 98.02 | 3.80 | 0.04 | 0.03 | 1.46 |
| G33 | 70.40 | 96.69 | 5.25 | 0.13 | 0.00 | 0.32 |
| G34 | 73.72 | 99.09 | 7.91 | 0.02 | 0.01 | 5.18 |
| G35 | 69.50 | 99.00 | 4.85 | 0.00 | 0.00 | 0.10 |
| G36 | 73.16 | 95.54 | 2.47 | 0.14 | 0.04 | 0.24 |
| G37 | 72.71 | 95.65 | 3.25 | 0.10 | 0.15 | 1.03 |
| G38 | 74.18 | 96.30 | 5.53 | 0.82 | 0.00 | 1.35 |
| G39 | 74.15 | 97.48 | 3.04 | 0.02 | 0.02 | 0.28 |
Average Milling Yield by Year
2019
2020
2021
2022
The 2022 data set is not complete but currently the average is sitting over 62 and so is a good improvement.